Overview
The map shows the Agile Outcomes across the Path to Agility stages and levels. You can interact with the elements in the map to drill down into capabilities, add work items, and conduct an Agile Outcome Poll to get a high-level heatmap.
Video of Map Screen
The video shows an older user interface. We are in the process of updating. General concepts are still valid.
* Video recorded with an older version of P2A Navigator.
Key User Interface Elements
Business Outcomes
BO Poll
Click 
See Facilitating a Live Poll for more details
Manually Setting Business Outcomes
- Click the
 button to manually set the Business Outcomes for your Organization
 - On the resulting pop up window, click on an individual Outcome card to toggle it on or off. (The blue highlight indicates that outcome is on." After making any changes, click "submit"
 button to manually set the Business Outcomes for your Organization
Highlighting Connections Between Business Outcomes and Agile Outcomes
At the top of the map area, clicking on one or more of the Organization's business outcomes will highlight the related Agile Outcomes on the map.

Launch Agile Outcome (AO) Poll
- Click the launch AO poll button

- All stages are included by default. Adjust as desired.
- Then click "Start" to launch the Agile Outcome Poll
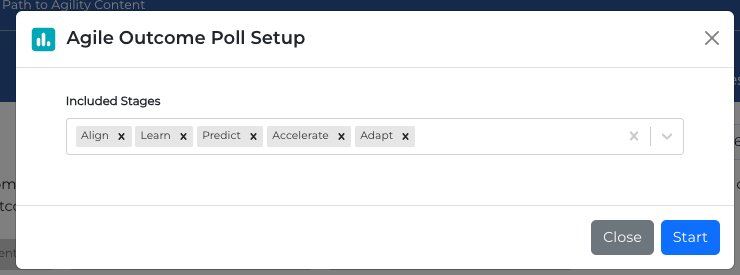
- For complete details, see Facilitating a Poll


If just beginning with Path to Agility and establishing a baseline, consider removing Accelerate and Adapt stages.
Controlling Map Display Details
 Use the right-side toolbar to toggle on or off the following map items:
- Trend lines
- Percent
- RAG
- Work Items
The legend at the bottom of the map shows the correlation of "RAG" color scale with percentages

Stages and Levels
The Map displays Agile Outcomes grouped in horizontal rows by level, and in vertical columns by state. For more details about stages and levels, see P2A Overview.
Expanding Levels
For organizations that have multiple systems and multiple teams created, the map will display a down arrow indicator for the row:
 Click on the down arrow to expand that level to show details for individual systems/teams:

Drill Downs
Agile Outcomes
Click on an Agile Outcome on the map to open a side panel.
The right side panel provides access to a number of details and functions including:
- Path to Agility Hierarchy (Stage, Level, etc)
- Description
- Progress Rating (Can be updated directly from the side panel)

- Agile Capabilities that are part of the displayed Agile Outcome, and their progress rating
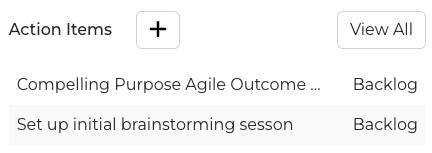
- Action Items (Can add action items directly from the side panel)


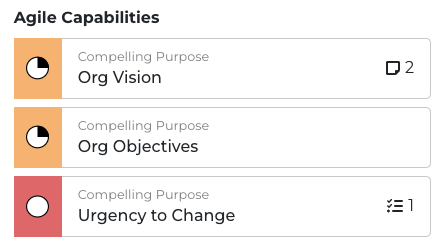
Agile Capabilities
Clicking on an Agile Capability in the Map side panel view displays similar information plus:
- Acceptance Criteria
- Notes
- History
Assessment Display and Data Export Functions
The map view has a number of filtering, display and data export function:

For more information refer to Assessments
Note: Due to software updates over time, there may be variations between screenshots, icons, buttons, and navigational elements in our online support documents and the Path the Agility Navigator platform
