Overview
Visualize performance and progress through a combination of roadmaps, business objectives, and action item backlogs.
Key User Interface Elements
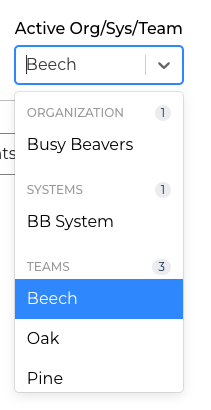
Select Focus Area for Dashboard
- Use the Active Org/System/Team drop-down to select the desired focus area
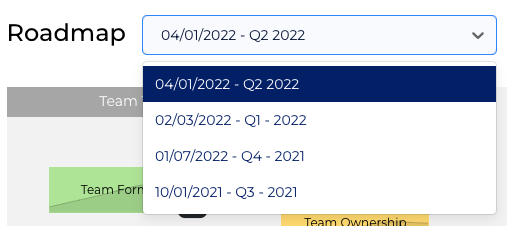
- Select the desired assessment from the Roadmap drop-down:
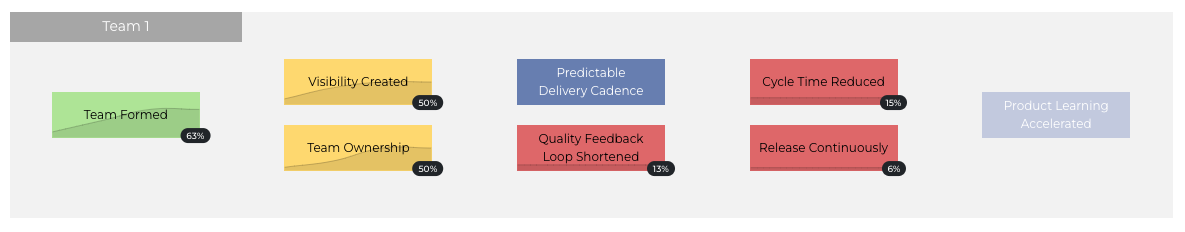
- The Dashboard will display progress (RAG and Percentage) and trend lines:


Drill Down
 Clicking an Agile Outcome will display details in a sidebar:
- Path to Agility Hierarchy (Stage, Level, etc)
- Selected Focus Area ("Team 1")
- Description of the Agile Outcome
- Corresponding Agile Capabilities
- Action Items (with RAG and percentage) that are part of the Agile Outcome
On the sidebar, clicking an Agile Capability will display additional information:
- Progress Rating (For the selected assessment; can be updated directly from the sidebar)
- Acceptance Criteria
- Action Items
- Notes
- History (Chronological listing of Progress Ratings - RAG - from all published assessments)
Business Outcome Objectives
The top Business Outcome selected for the selected focus area.
For details, see: Prioritization and Facilitating a Live Poll

Action Items
All action items related to the selected focus area..
For details, see: Actions

Capabilities Backlog
The top three priorities for Agile Capabilities.
For details, see: Prioritization and Creating and Maintaining a Team Transformation Backlog

